import dascore as dc
patch = dc.get_example_patch()

# Create a spectrogram plot
ax = patch.viz.spectrogram(show=False)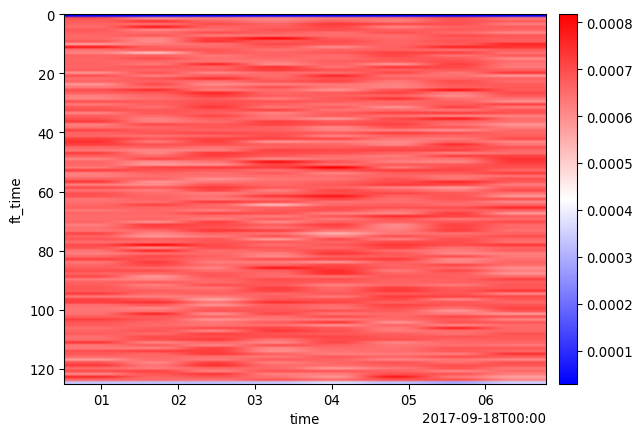
spectrogram(
patch: Patch ,
ax: matplotlib.axes._axes.Axes | None[Axes, None] = None,
dim = time,
aggr_domain = frequency,
cmap = bwr,
scale: float | collections.abc.Sequence[float, collections.abc.Sequence[float], None] = None,
scale_type: Literal[‘relative’, ‘absolute’] = relative,
log = False,
show = False,
**kwargs ,
)-> ‘plt.Axes’
Plot a spectrogram of a patch.
| Parameter | Description |
|---|---|
| patch : PatchType | The Patch object. |
| ax : matplotlib.axes.Axes or None, optional | A matplotlib axis object. If None, creates a new axis. |
| dim : str, optional |
Dimension along which the spectrogram is being plotted. Default is “time”. |
| aggr_domain : str, optional |
“time” or “frequency” in which the mean value of the other dimension is calculated. No need to specify if the other dimension’s coordinate size is 1. Default is “frequency”. |
| cmap : str or matplotlib.colors.Colormap, optional |
A matplotlib colormap string or instance. Set to None to not plot the colorbar. Default is “bwr”. |
| scale : float, tuple of floats, or None, optional |
If not None, controls the saturation level of the colorbar. Values can be a single float or a length-2 tuple specifying upper and lower limits. See scale_type for more details.
|
| scale_type : {“relative”, “absolute”}, optional |
Specifies the type of scaling: - “relative”: Scale based on half the dynamic range in the patch. - “absolute”: Scale based on absolute values provided to scale.Default is “relative”. |
| log : bool, optional | If True, visualize the common logarithm of the absolute values of patch data. |
| show : bool, optional | If True, show the plot. Otherwise, just return the axis. |
| **kwargs : dict, optional |
Passed to scipy.signal.spectrogram to control spectrogram options.See its documentation for options. |
import dascore as dc
patch = dc.get_example_patch()
# Create a spectrogram plot
ax = patch.viz.spectrogram(show=False)