# Plot patch
import dascore as dc
patch = dc.get_example_patch("random_patch_with_lat_lon")
patch = patch.set_units(latitude="m", longitude="m")
_ = patch.viz.map_fiber("latitude", "longitude", "distance")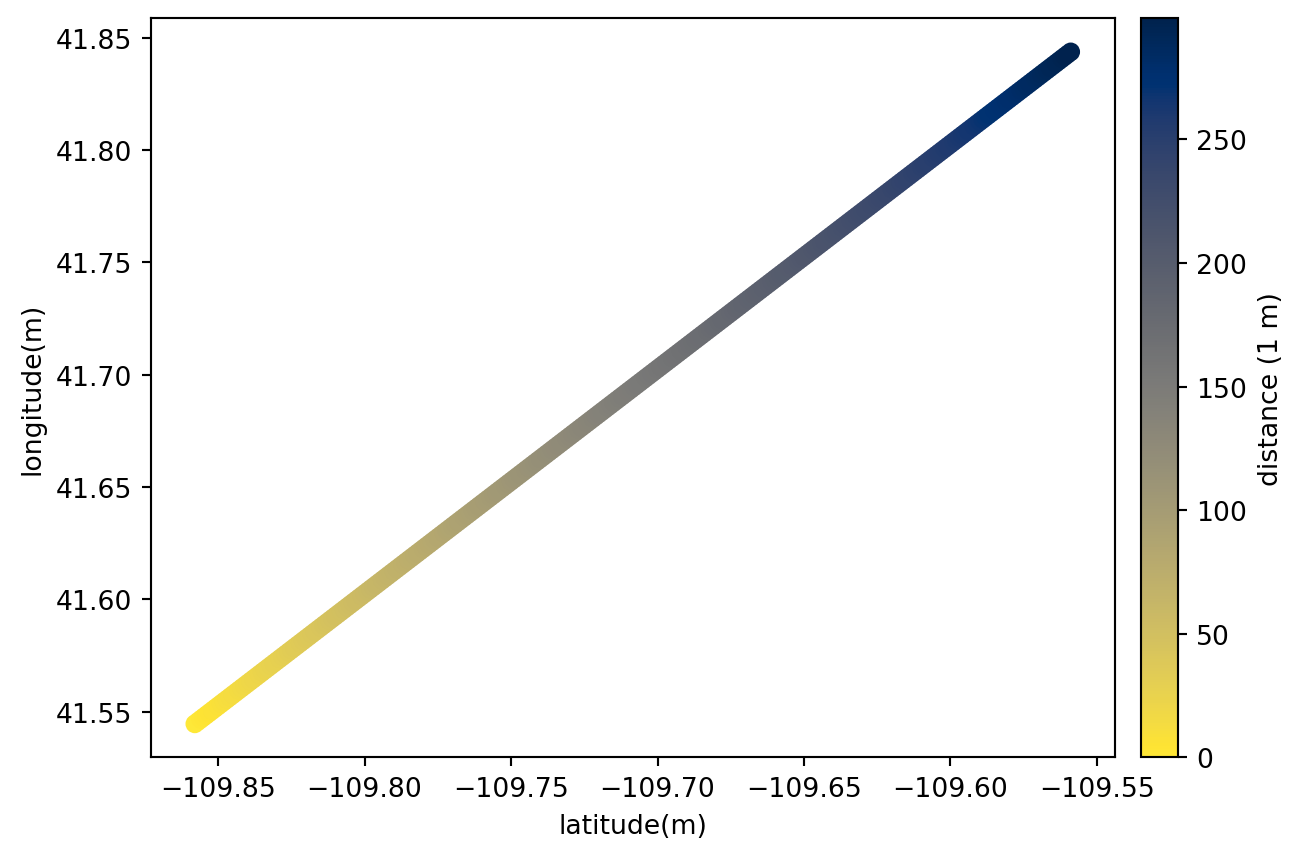
map_fiber(
patch: Patch ,
x: numpy.ndarray | str[ndarray, str] = distance,
y: numpy.ndarray | str[ndarray, str] = distance,
color: numpy.ndarray | str[ndarray, str] = distance,
ax: matplotlib.axes._axes.Axes | None[Axes, None] = None,
cmap = cividis_r,
scale: float | collections.abc.Sequence[float, collections.abc.Sequence[float], None] = None,
scale_type: Literal[‘relative’, ‘absolute’] = relative,
show = False,
)-> ‘plt.Axes’
Create a plot of the outline of the cable colorized by a given parameter.
| Parameter | Description |
|---|---|
| patch | The Patch object. |
| x | x coordinate: can be an array or a str representing a patch coordinate. |
| y | y coordinate: can be an array or a str representing a patch coordinate. |
| color |
The color parameter to plot: can be an array or a str representing a patch attribute. |
| ax | A matplotlib object, if None create one. |
| cmap |
A matplotlib colormap string or instance. Set to None to not plot the colorbar. |
| scale |
If not None, controls the saturation level of the colorbar. Values can either be a float, to set upper and lower limit to the same value centered around the mean of the data, or a length 2 tuple specifying upper and lower limits. See scale_type for controlling howvalues are scaled. |
| scale_type |
Controls the type of scaling specified by scale parameter. Optionsare: relative - scale based on half the dynamic range in patch absolute - scale based on absolute values provided to scale
|
| show | If True, show the plot, else just return axis. |
# Plot patch
import dascore as dc
patch = dc.get_example_patch("random_patch_with_lat_lon")
patch = patch.set_units(latitude="m", longitude="m")
_ = patch.viz.map_fiber("latitude", "longitude", "distance")