Filter the patch over certain slopes in the 2D Fourier domain.
Most commonly this is used as an F-K (frequency wavenumber) filter to attenuate energy with specified apparent velocities.
Parameters
Parameter
Description
patch
The patch to filter.
filt
A length 4 array of the form [va, vb, vc, vd]. If notch is False, the filter selects the apparent velocities between ‘vb’ and ‘vc’ with tapering boundaries from ‘va’ to ‘vb’ and from ‘vc’ to ‘vd’.
dims
The dimensions used to determine slope. The first dim is in the numerator and the second in the denominator. (eg distance, time) represents a velocity since distance/time has units of |L|/|T| (commonly m/s).
directional
If True, the filter should be considered direction. That is to say, the sign of the values in filt indicate the direction (towards or away) with increasing coordinate values. This can be used for up/down or left/right separation, assuming a near-linear fiber layout.
notch
Deprecated, use invert.
invert
If True, the filter represents a notch, meaning the slopes specified by the inner filt parameters are attenuated rather than those outside of them.
Examples
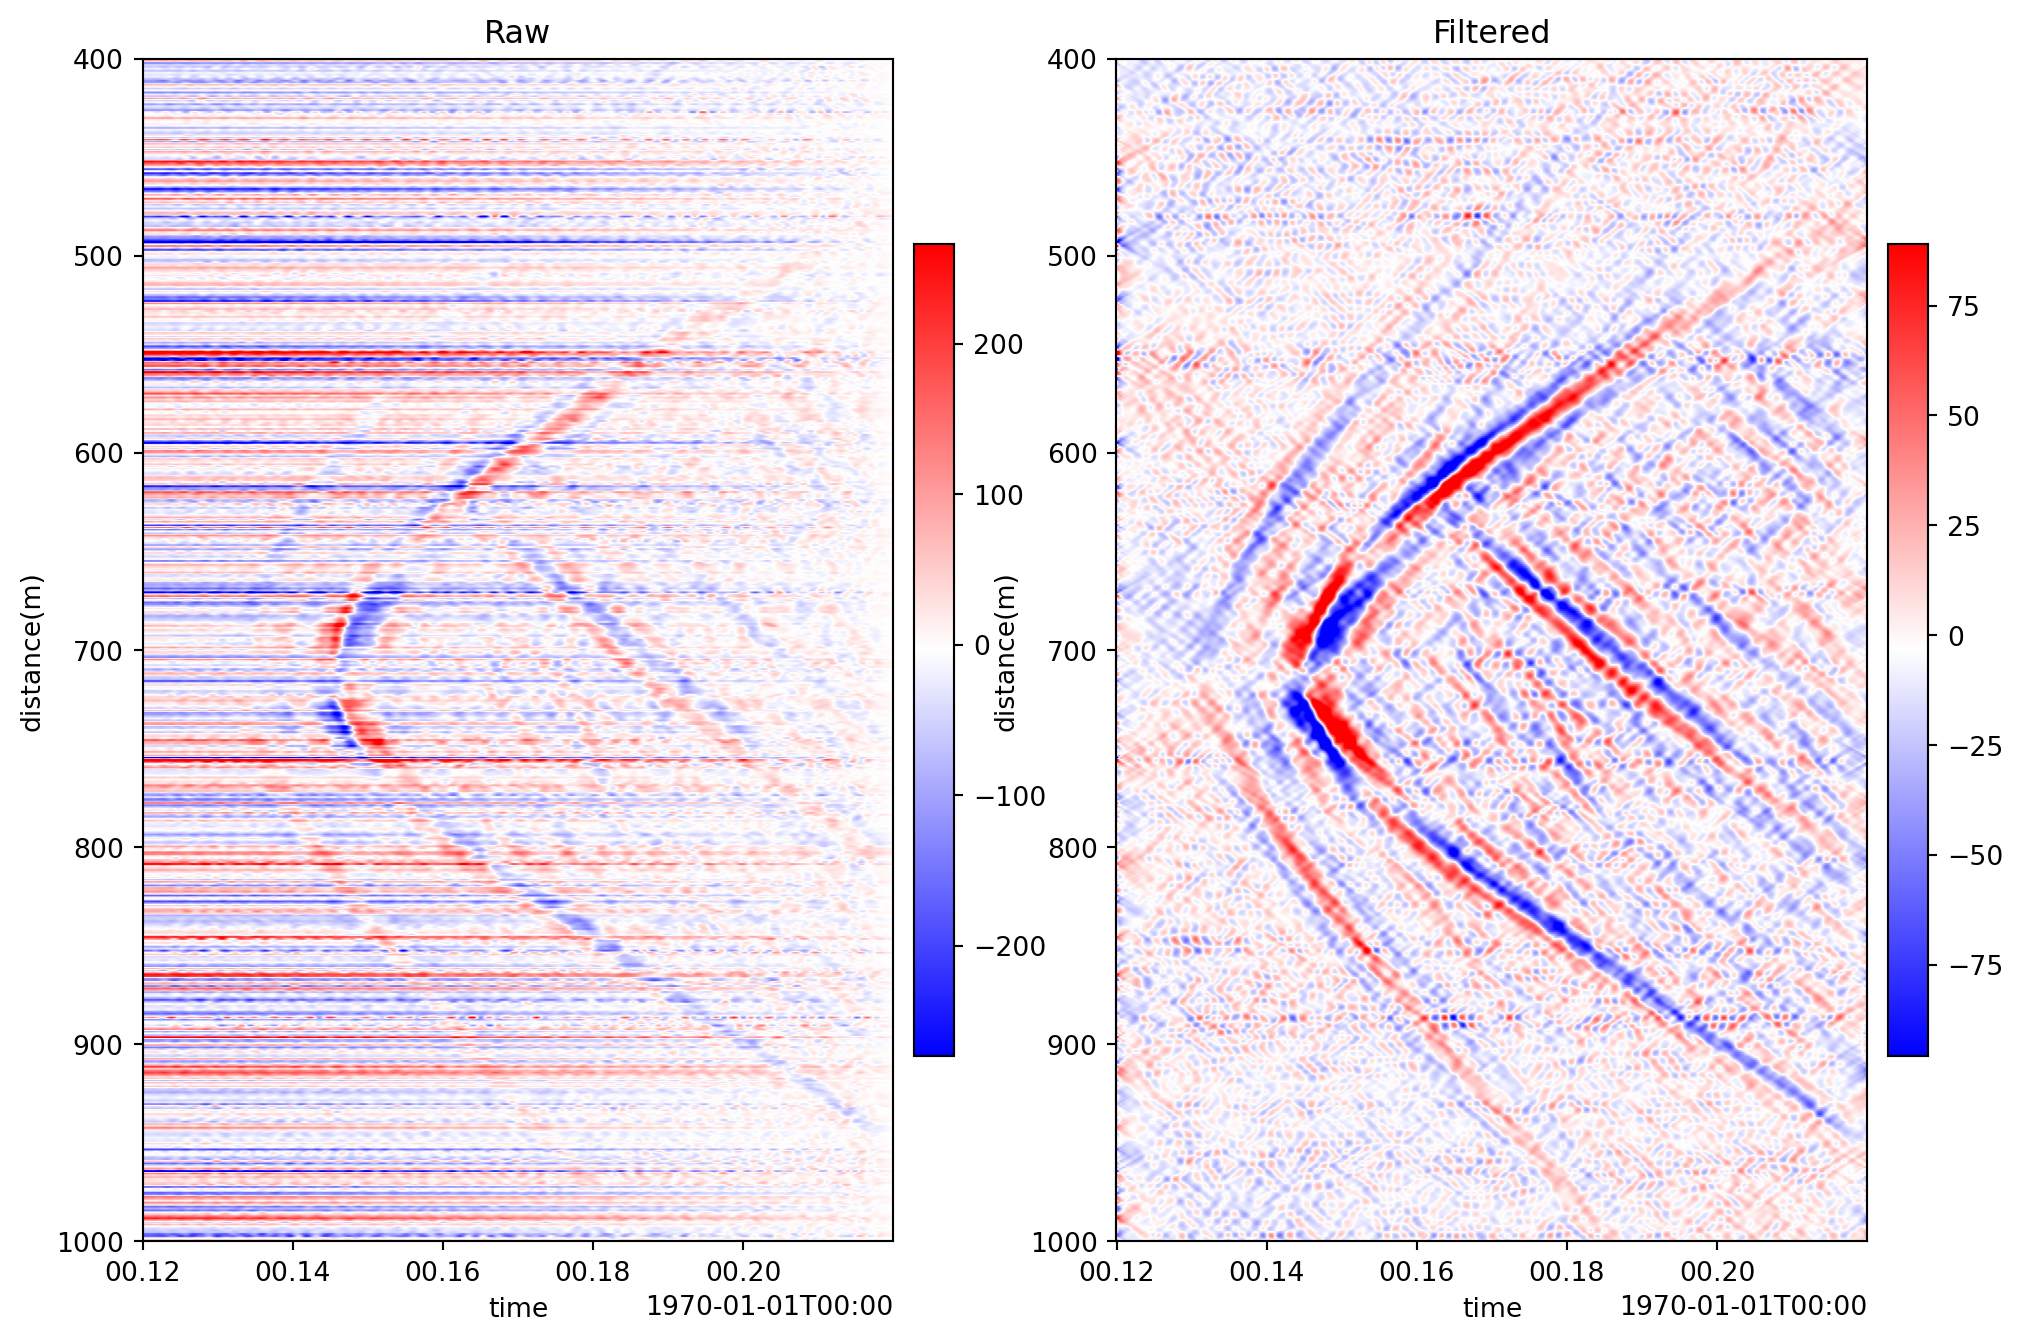
# Example 1: Compare slope filtered patch to Non-filtered.import matplotlib.pyplot as pltimport numpy as npimport dascore as dcfrom dascore.units import Hz# Apply taper function and bandpass filter along time axis from 1 to 500 Hzpatch = ( dc.get_example_patch('example_event_1') .set_units(distance='m', time='s') .taper(time=0.05) .pass_filter(time=(1*Hz, 500*Hz)))filt = np.array([2e3,2.2e3,8e3,2e4])# Apply fk filterpatch_filtered = patch.slope_filter( filt=filt, directional=False, invert=False)# Plot resultsfig, (ax1, ax2) = plt.subplots(1, 2, figsize=(12, 8))ax1 = patch.viz.waterfall(ax=ax1, scale=0.5)_ = ax1.set_title('Raw')ax2 = patch_filtered.viz.waterfall(ax=ax2, scale=0.5)_ = ax2.set_title('Filtered')# Example 2: Inverted (notch) filterpatch_filtered = patch.slope_filter(filt=filt, invert=True)# Example 3: specify unitsfilt = np.array([2e3,2.2e3,8e3,2e4]) * dc.get_unit("m/s")patch_filtered = patch.slope_filter(filt=filt)