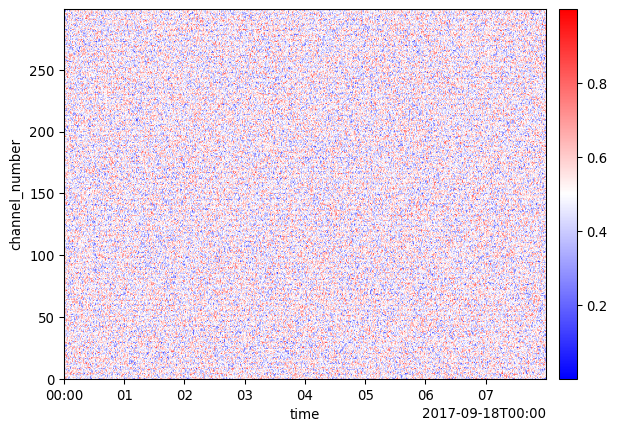
Rather than plotting distance or depth, sometimes it is desirable to plot channel number (an index of the non-time dimension).
To do this involves three steps:
Adding a new coordinate called channel number
Setting the channel number as the dimension
Call plot function
import numpy as npimport dascore as dcpatch = dc.get_example_patch()# get length of distance axisdist_len = patch.coord_shapes["distance"][0]# create range from 0 to dist_lenchannel_number = np.arange(dist_len)out = (# first add channel number to coords. patch.update_coords(channel_number=("distance", channel_number))# then make channel number a dimensional coordinate .set_dims(distance="channel_number"))# then plotout.viz.waterfall();